What is Technical Analysis ?
This guide explains technical analysis, a method used by traders to forecast price movements by analyzing historical data, trends, and patterns. It covers essential tools such as price charts, trendlines, support and resistance, and technical indicators like moving averages and RSI. By understanding these tools and principles, traders can identify profitable entry and exit points. While technical analysis is ideal for short-term trading, combining it with fundamental analysis can provide a balanced approach to investment decisions.
TECHNICAL ANALYSIS
12/14/20246 min read


In This Post:
Introduction
Core Principles of Technical Analysis
Price Discounts Everything
Prices Move in Trends
History Repeats Itself
Key Tools and Techniques
Price Charts (Line, Bar, and Candlestick Charts)
Trendlines (Uptrend, Downtrend, Sideways)
Support and Resistance Levels
Technical Indicators (Moving Averages, RSI, MACD, Bollinger Bands)
Chart Patterns (Head and Shoulders, Double Tops/Bottoms, Triangles)
Technical Analysis vs. Fundamental Analysis
Benefits of Technical Analysis
Limitations of Technical Analysis
Conclusion
Key Takeaways
Price-Driven Analysis: Technical analysis relies on historical price data and market trends rather than a company’s financial fundamentals.
Core Concepts: It operates on the principles that prices reflect all available information, move in trends, and that market behavior tends to repeat itself.
Essential Tools: Key techniques include analyzing charts, drawing trendlines, identifying support and resistance levels, using indicators like moving averages and RSI, and recognizing chart patterns.
Trading Strategies: Helps traders time their entry and exit points, making it especially useful for short-term trading.
Comparison: Unlike fundamental analysis, which focuses on intrinsic value, technical analysis focuses on market sentiment and price movements.
What is Technical Analysis ?
Technical analysis is a method of evaluating financial markets by analyzing historical price movements, trading volume, and other market data to predict future price behavior. Instead of focusing on a company's financial statements, management, or competitive position, technical analysis relies on charts, patterns, and indicators to understand market trends and sentiment. The underlying assumption is that all available information is already reflected in the price of a security, and that price movements tend to follow identifiable patterns over time.
This approach is widely used in trading stocks, commodities, currencies, and cryptocurrencies. Traders and investors who use technical analysis believe that by recognizing patterns and using indicators, they can forecast the direction of prices and identify profitable trading opportunities.
In this guide, we will explore the core principles of technical analysis, key tools and techniques, common chart patterns, practical examples, and the benefits and limitations of this approach. Whether you are a beginner or an experienced trader, understanding technical analysis can significantly enhance your ability to make informed decisions.
Core Principles of Technical Analysis
Technical analysis is built on three foundational principles:
Price Discounts Everything: This principle holds that the price of a security reflects all available information, including company performance, economic data, market sentiment, and news events. Consequently, studying price movements alone can provide a comprehensive view of market behavior.
Prices Move in Trends: Technical analysts believe that prices move in trends—upward, downward, or sideways—rather than randomly. By identifying these trends, traders can predict the likely direction of future price movements.
History Repeats Itself: Market participants tend to react similarly to similar situations, creating recurring patterns and trends. Because human behavior and psychology don’t change drastically, patterns observed in the past are likely to repeat in the future.
Key Tools and Techniques in Technical Analysis
Technical analysis employs a range of tools to study price movements and market trends. Here are some of the most commonly used techniques, along with real-world examples to illustrate their application.
1. Price Charts
Charts are the backbone of technical analysis. They visually display historical price data and help traders identify trends and patterns.
Line Charts: These charts connect the closing prices over a specified period, providing a clear picture of the overall trend.
Example: A line chart showing the closing price of Apple (AAPL) over six months might reveal a steady upward trend, indicating potential for continued growth.Bar Charts: Bar charts display the opening, closing, high, and low prices for each period. Each bar represents one period, such as a day or an hour.
Example: In a bar chart for Tesla (TSLA), a series of bars with higher highs and higher lows would indicate an uptrend.Candlestick Charts: These charts provide the same information as bar charts but use “candlesticks” that are color-coded to show bullish (upward) or bearish (downward) trends.
Example: A candlestick chart for Microsoft (MSFT) might show a series of green candlesticks, indicating a strong buying trend, followed by a red candlestick, suggesting a potential reversal.
2. Trendlines
Trendlines are lines drawn on a chart to connect consecutive highs or lows, helping to visualize the direction of the market.
Uptrend: A trendline connecting higher lows shows a sustained upward movement.
Example: If Amazon (AMZN) has been making a series of higher lows over several months, a trendline drawn under these lows helps confirm an uptrend.Downtrend: A trendline connecting lower highs shows a sustained downward movement.
Example: If General Electric (GE) stock is consistently making lower highs, a trendline above these highs indicates a bearish trend.Sideways Trend: Prices move within a horizontal range, neither trending up nor down.
Example: IBM trading between $120 and $130 for several weeks without breaking out of this range signals a period of market indecision.
3. Support and Resistance Levels
Support: A price level where buying pressure is strong enough to prevent the price from falling further.
Example: If Netflix (NFLX) repeatedly bounces back up when it reaches $400, that level acts as support.Resistance: A price level where selling pressure prevents the price from rising further.
Example: If Coca-Cola (KO) struggles to break above $65, that price becomes a resistance level.
Traders often use support and resistance to decide when to enter or exit a trade. If a stock breaks through a resistance level, it might indicate that a further rally is likely.
4. Technical Indicators
Technical indicators are mathematical calculations based on price, volume, or open interest. These indicators help traders confirm trends, measure momentum, and identify potential reversals.
Moving Averages (MA): Smooth out price data to reveal the underlying trend. The 50-day and 200-day moving averages are popular benchmarks.
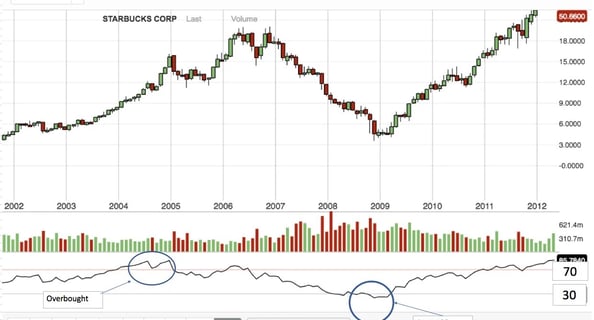
Example: If the 50-day moving average of Google (GOOG) crosses above the 200-day moving average (a “golden cross”), it signals a potential bullish trend.Relative Strength Index (RSI): Measures the speed and magnitude of price movements to identify overbought or oversold conditions.
Example: If Nike (NKE) has an RSI above 70, it might be overbought and due for a pullback.MACD (Moving Average Convergence Divergence): Tracks the relationship between two moving averages to identify trend reversals.
Example: A MACD crossover for Facebook (META) might suggest a shift from bearish to bullish sentiment.
5. Chart Patterns
Chart patterns are formations that repeat over time and signal potential price movements.
Head and Shoulders: Indicates a trend reversal from bullish to bearish.
Example: If Boeing (BA) forms a head and shoulders pattern, traders may anticipate a decline.Double Top and Double Bottom: Reversal patterns that signal a change in trend direction.
Example: A double bottom in Ford (F) might indicate that a downtrend is ending and an uptrend is beginning.Triangles: These patterns, such as ascending, descending, or symmetrical triangles, signal consolidation before a breakout.
Example: An ascending triangle in Shopify (SHOP) might indicate a potential upward breakout.
Technical Analysis vs. Fundamental Analysis
Technical and fundamental analysis represent two different approaches to evaluating investments.
Technical Analysis: Focuses on price movements, trends, and market data to predict future price behavior. Ideal for short-term trading.
Fundamental Analysis: Examines a company’s financial health, earnings, and industry position to determine its intrinsic value. Better suited for long-term investing.
Many investors use a combination of both approaches to get a well-rounded view of potential opportunities.
Benefits of Technical Analysis
Timing Trades: Helps identify the best entry and exit points.
Quick Insights: Provides a fast way to assess market conditions without detailed financial reports.
Applicable to Multiple Markets: Works for stocks, forex, commodities, and cryptocurrencies.
Visual Clarity: Charts and indicators offer clear, visual cues for decision-making.
Captures Short-Term Opportunities: Effective for traders who seek to profit from short-term price movements.
Limitations of Technical Analysis
Subjectivity: Different traders may interpret the same chart differently.
Market Noise: Short-term fluctuations can create false signals.
No Fundamental Insight: Ignores company-specific and economic fundamentals.
Past Patterns May Not Repeat: Historical patterns do not always predict future outcomes.
Self-Fulfilling Prophecy: Patterns may work because many traders believe in them and act accordingly.
Conclusion
Technical analysis is a valuable tool for traders and investors who want to understand market trends and identify trading opportunities based on price movements. By using charts, trendlines, support and resistance levels, technical indicators, and chart patterns, traders can gain insights into market behavior and improve their timing for buying and selling securities. While technical analysis has its limitations, combining it with fundamental analysis can provide a balanced approach to investing. Understanding how to read and interpret market data is a crucial skill for anyone looking to succeed in today’s dynamic financial markets.